HDS Agent Dashboard
Highway Data Systems — Dashboard Portal
Username
Password
Sign In
HDS Agent Dashboard
Highway Data Systems — Analytics & Reporting
Sign Out
EVO Tools
📋 EVO Job Board
Browse Monday.com job boards, view squads/gangs and subitems, search jobs, and generate EVO files — web version of the desktop app.
HTML
42 KB
Modified: 8 June 2026
📦 EVO File Tracker
Track all created EVO files — status lifecycle (Created → Downloaded → Complete), download history, and event audit trail.
HTML
35 KB
Modified: 8 June 2026
Interactive Dashboards
Eurovia Quality Dashboard
7-tab quality analysis — LSE, 3DTD, ROS, roller metrics, compaction and regional breakdowns for Eurovia sites.
HTML
418 KB
Modified: 2 June 2026
Eurovia 2026 Quality League Table
Regional quality rankings — composite scoring across temperature, weather, regularity, efficiency and kit usage. Click regions for job-level drill-down.
HTML
371 KB
Modified: 5 June 2026
Eurovia CO2 Dashboard
6-tab carbon emissions analysis — temperature efficiency, fuel usage, and environmental metrics across Eurovia operations.
HTML
100 KB
Modified: 2 June 2026
ABR Thermal Dashboard
Full ABR site thermal profiling with 7 analysis tabs — batch cycles, temperature compliance, and production patterns.
HTML
2.0 MB
Modified: 29 May 2026
ABR Thermal Dashboard v2
Compact ABR thermal analysis — updated layout and metrics.
HTML
254 KB
Modified: 28 May 2026
🎯 Demo Thermal Dashboard
Fully interactive demo with simulated UK data — 3 fictional plants (Leeds, Bristol, Edinburgh), ePlant + eSilo + eTicket, June 2026. Login: Demo / demo2026
DEMO
535 KB
Modified: 22 June 2026
ePlant Thermal Dashboard
Plant-level thermal monitoring — batch temperatures, warming/cooling cycles, and spec compliance.
HTML
602 KB
Modified: 26 May 2026
May 2026 Anomaly Report
Monthly anomaly detection — flagged temperature outliers, unusual patterns, and data quality issues.
HTML
248 KB
Modified: 26 May 2026
London Interactive Map
Geospatial view of London-area HDS site locations and activity.
HTML
89 KB
Modified: 22 May 2026
Site Charts
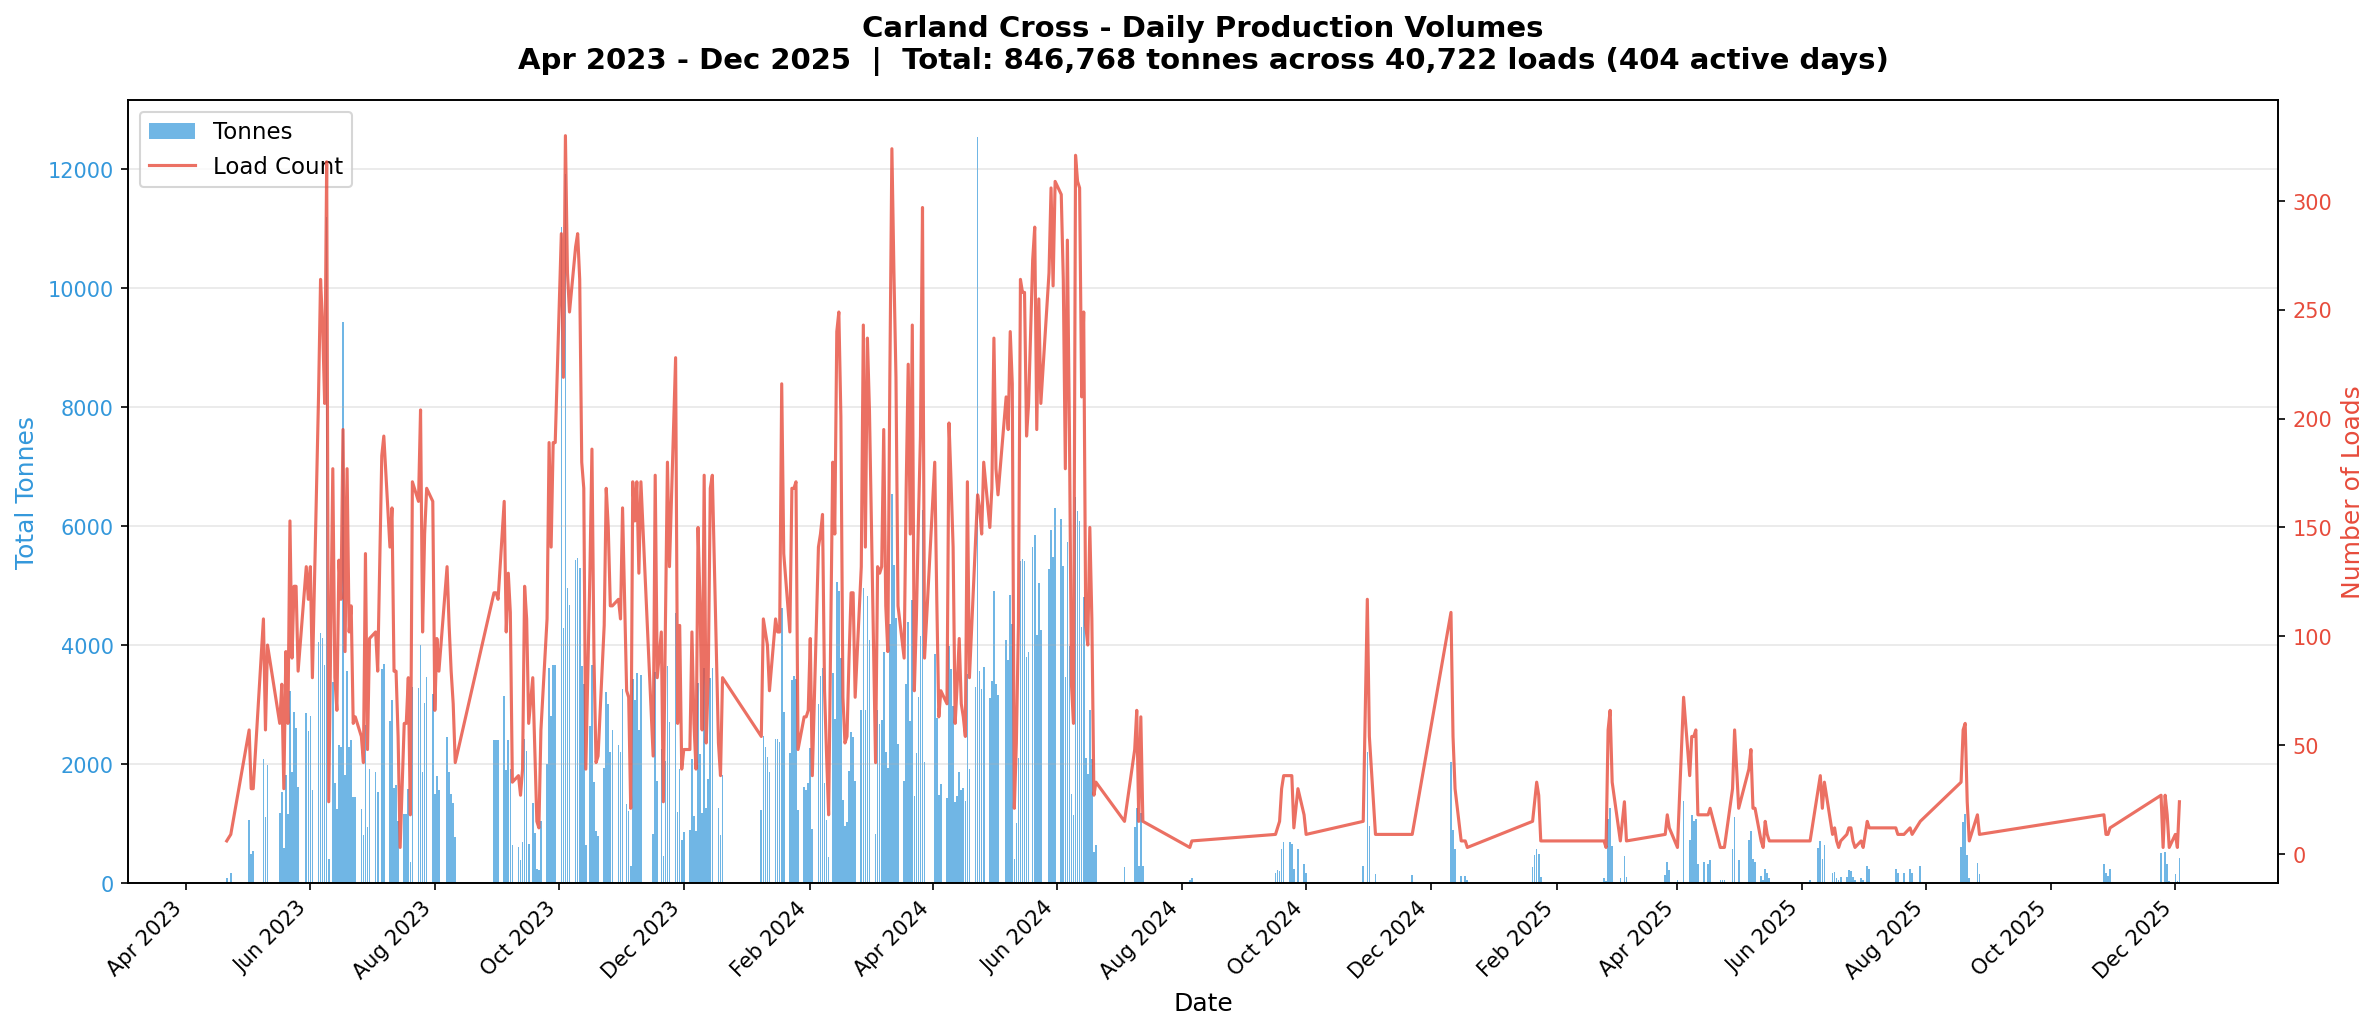
Carland Cross — Daily Production
Daily production output chart for Carland Cross site.
PNG
259 KB
Modified: 22 May 2026
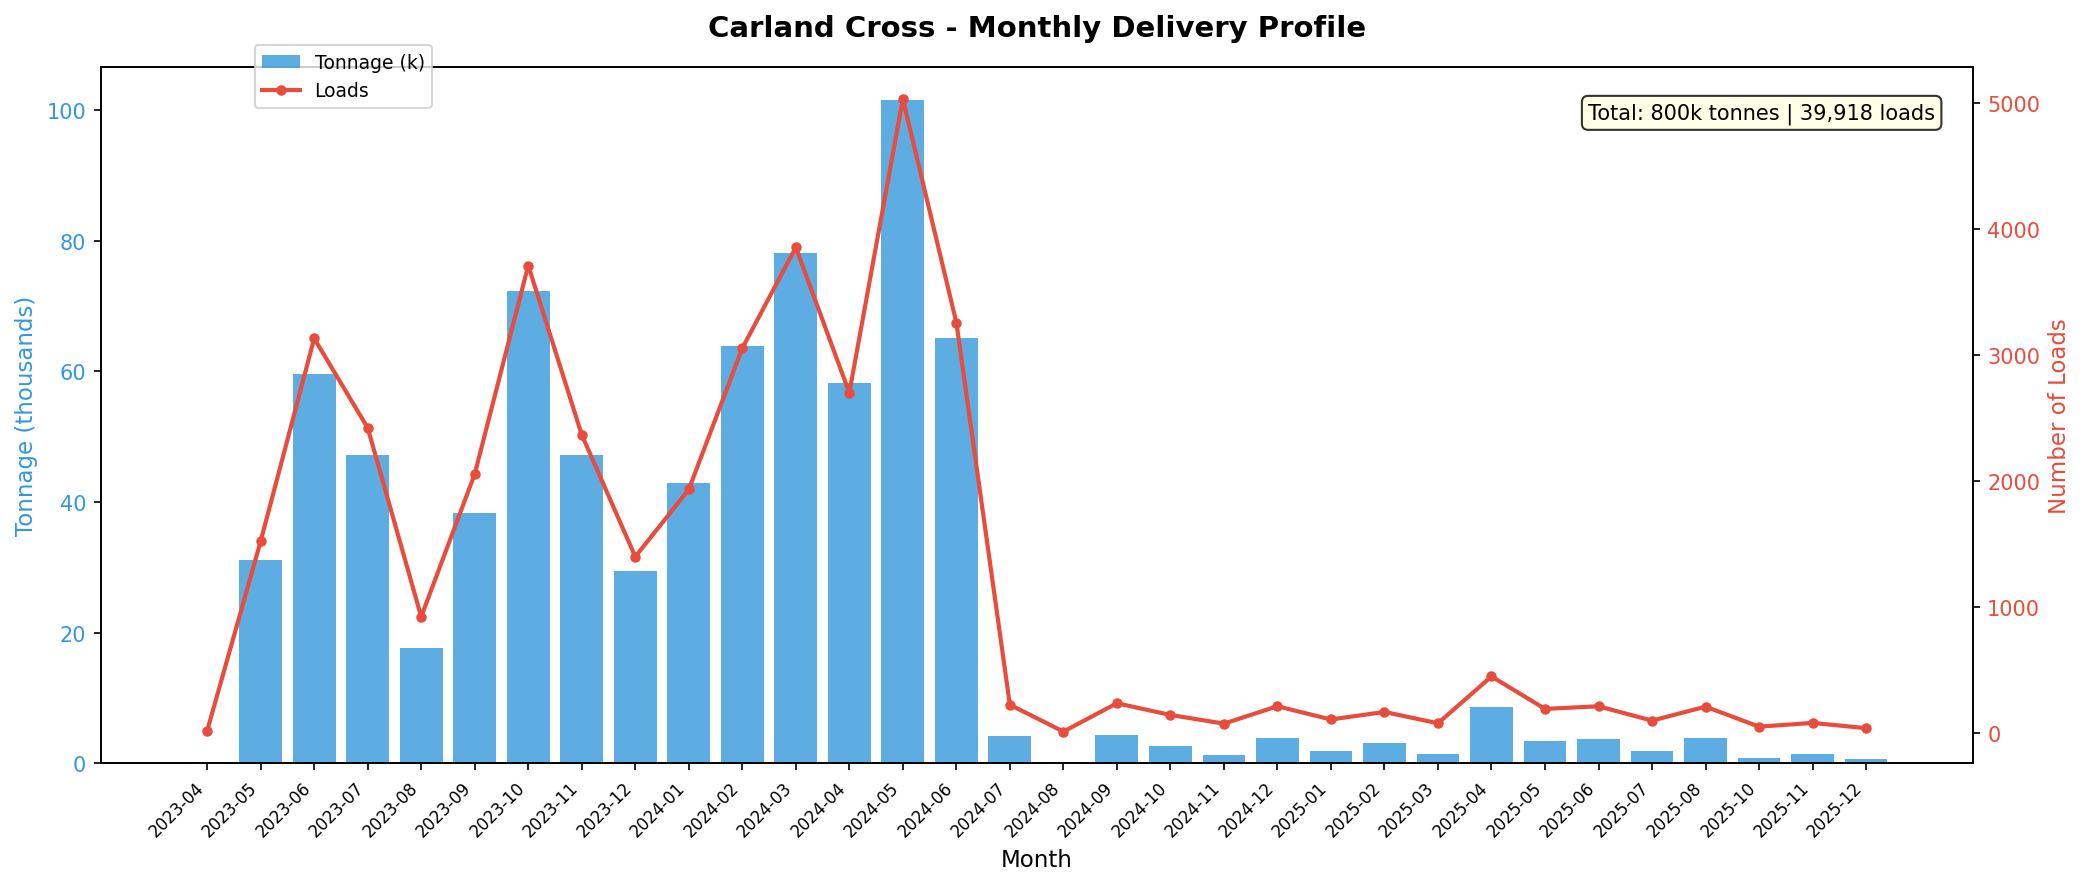
Carland Cross — Monthly
Monthly production summary for Carland Cross.
PNG
125 KB
Modified: 22 May 2026
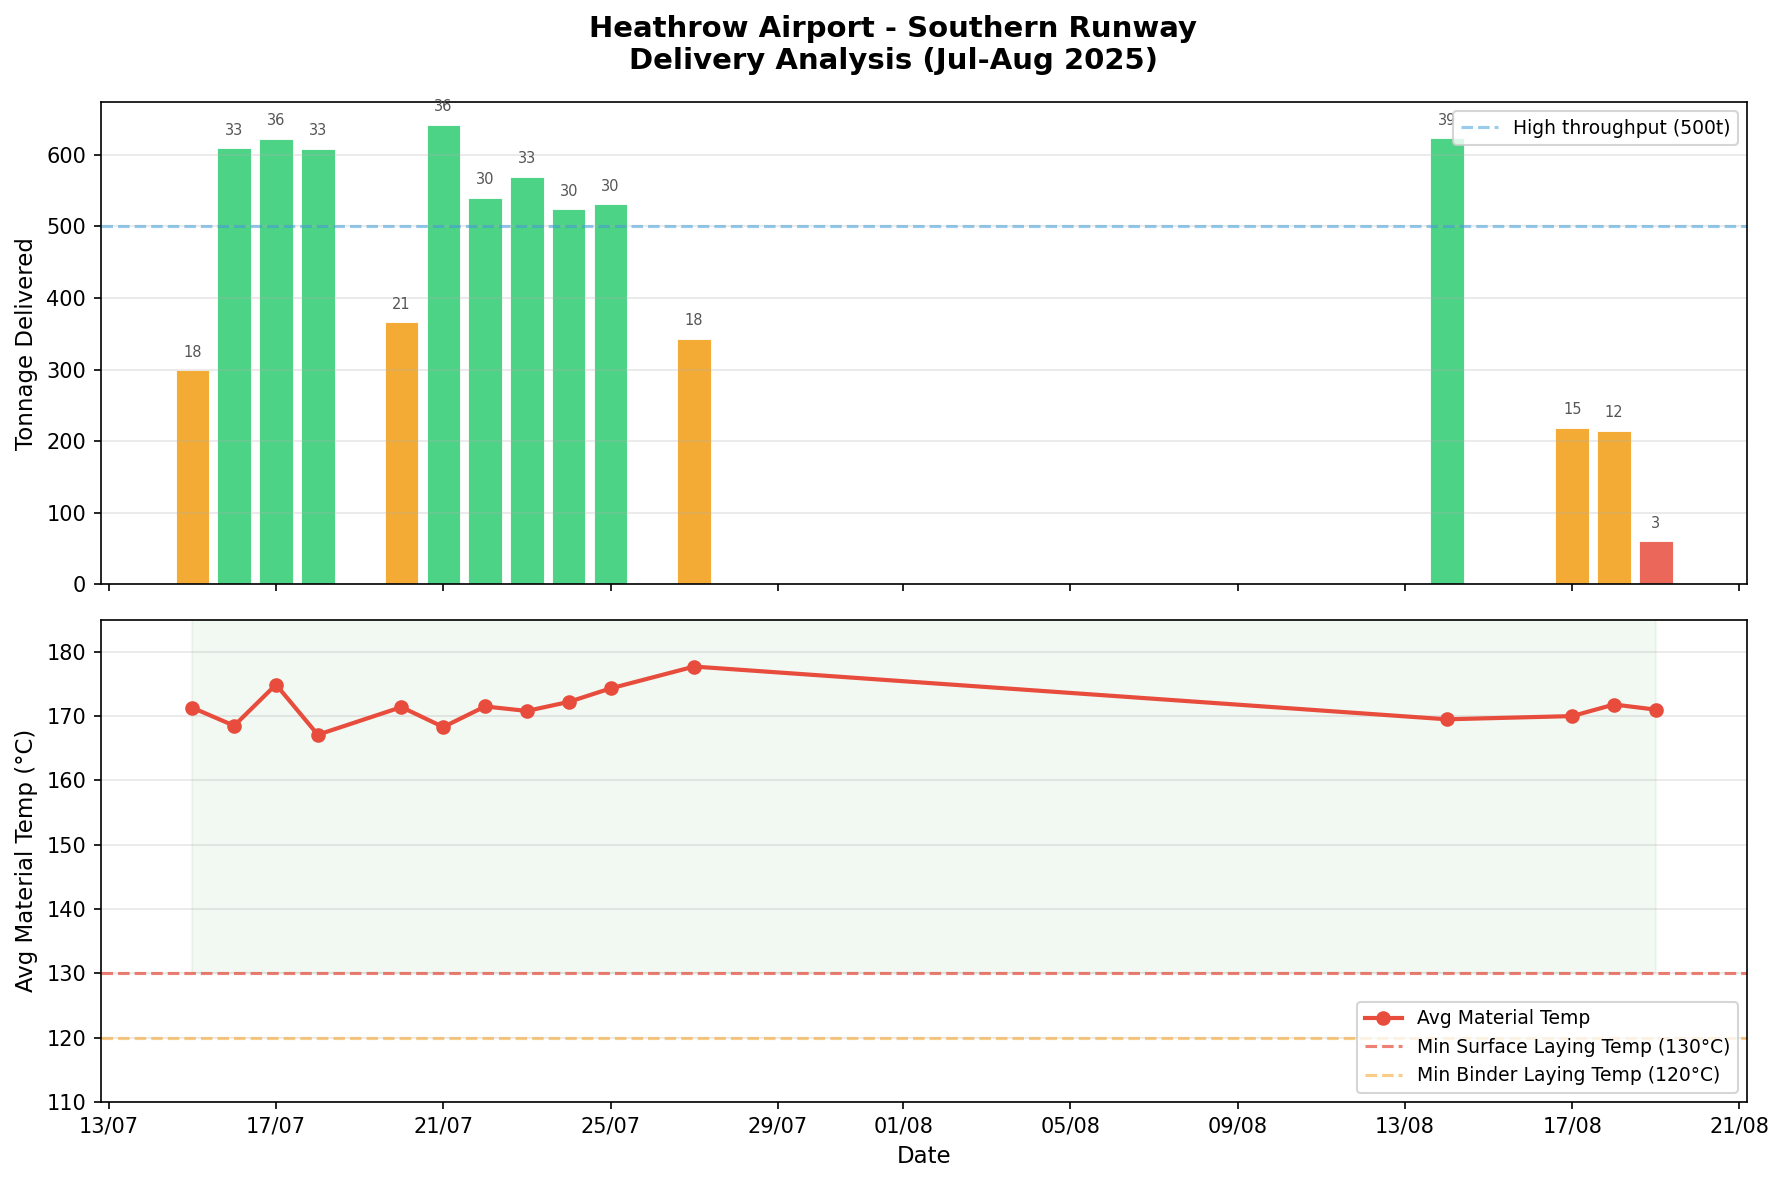
Heathrow Delivery Analysis
Delivery temperature and timing analysis for Heathrow site.
PNG
113 KB
Modified: 22 May 2026
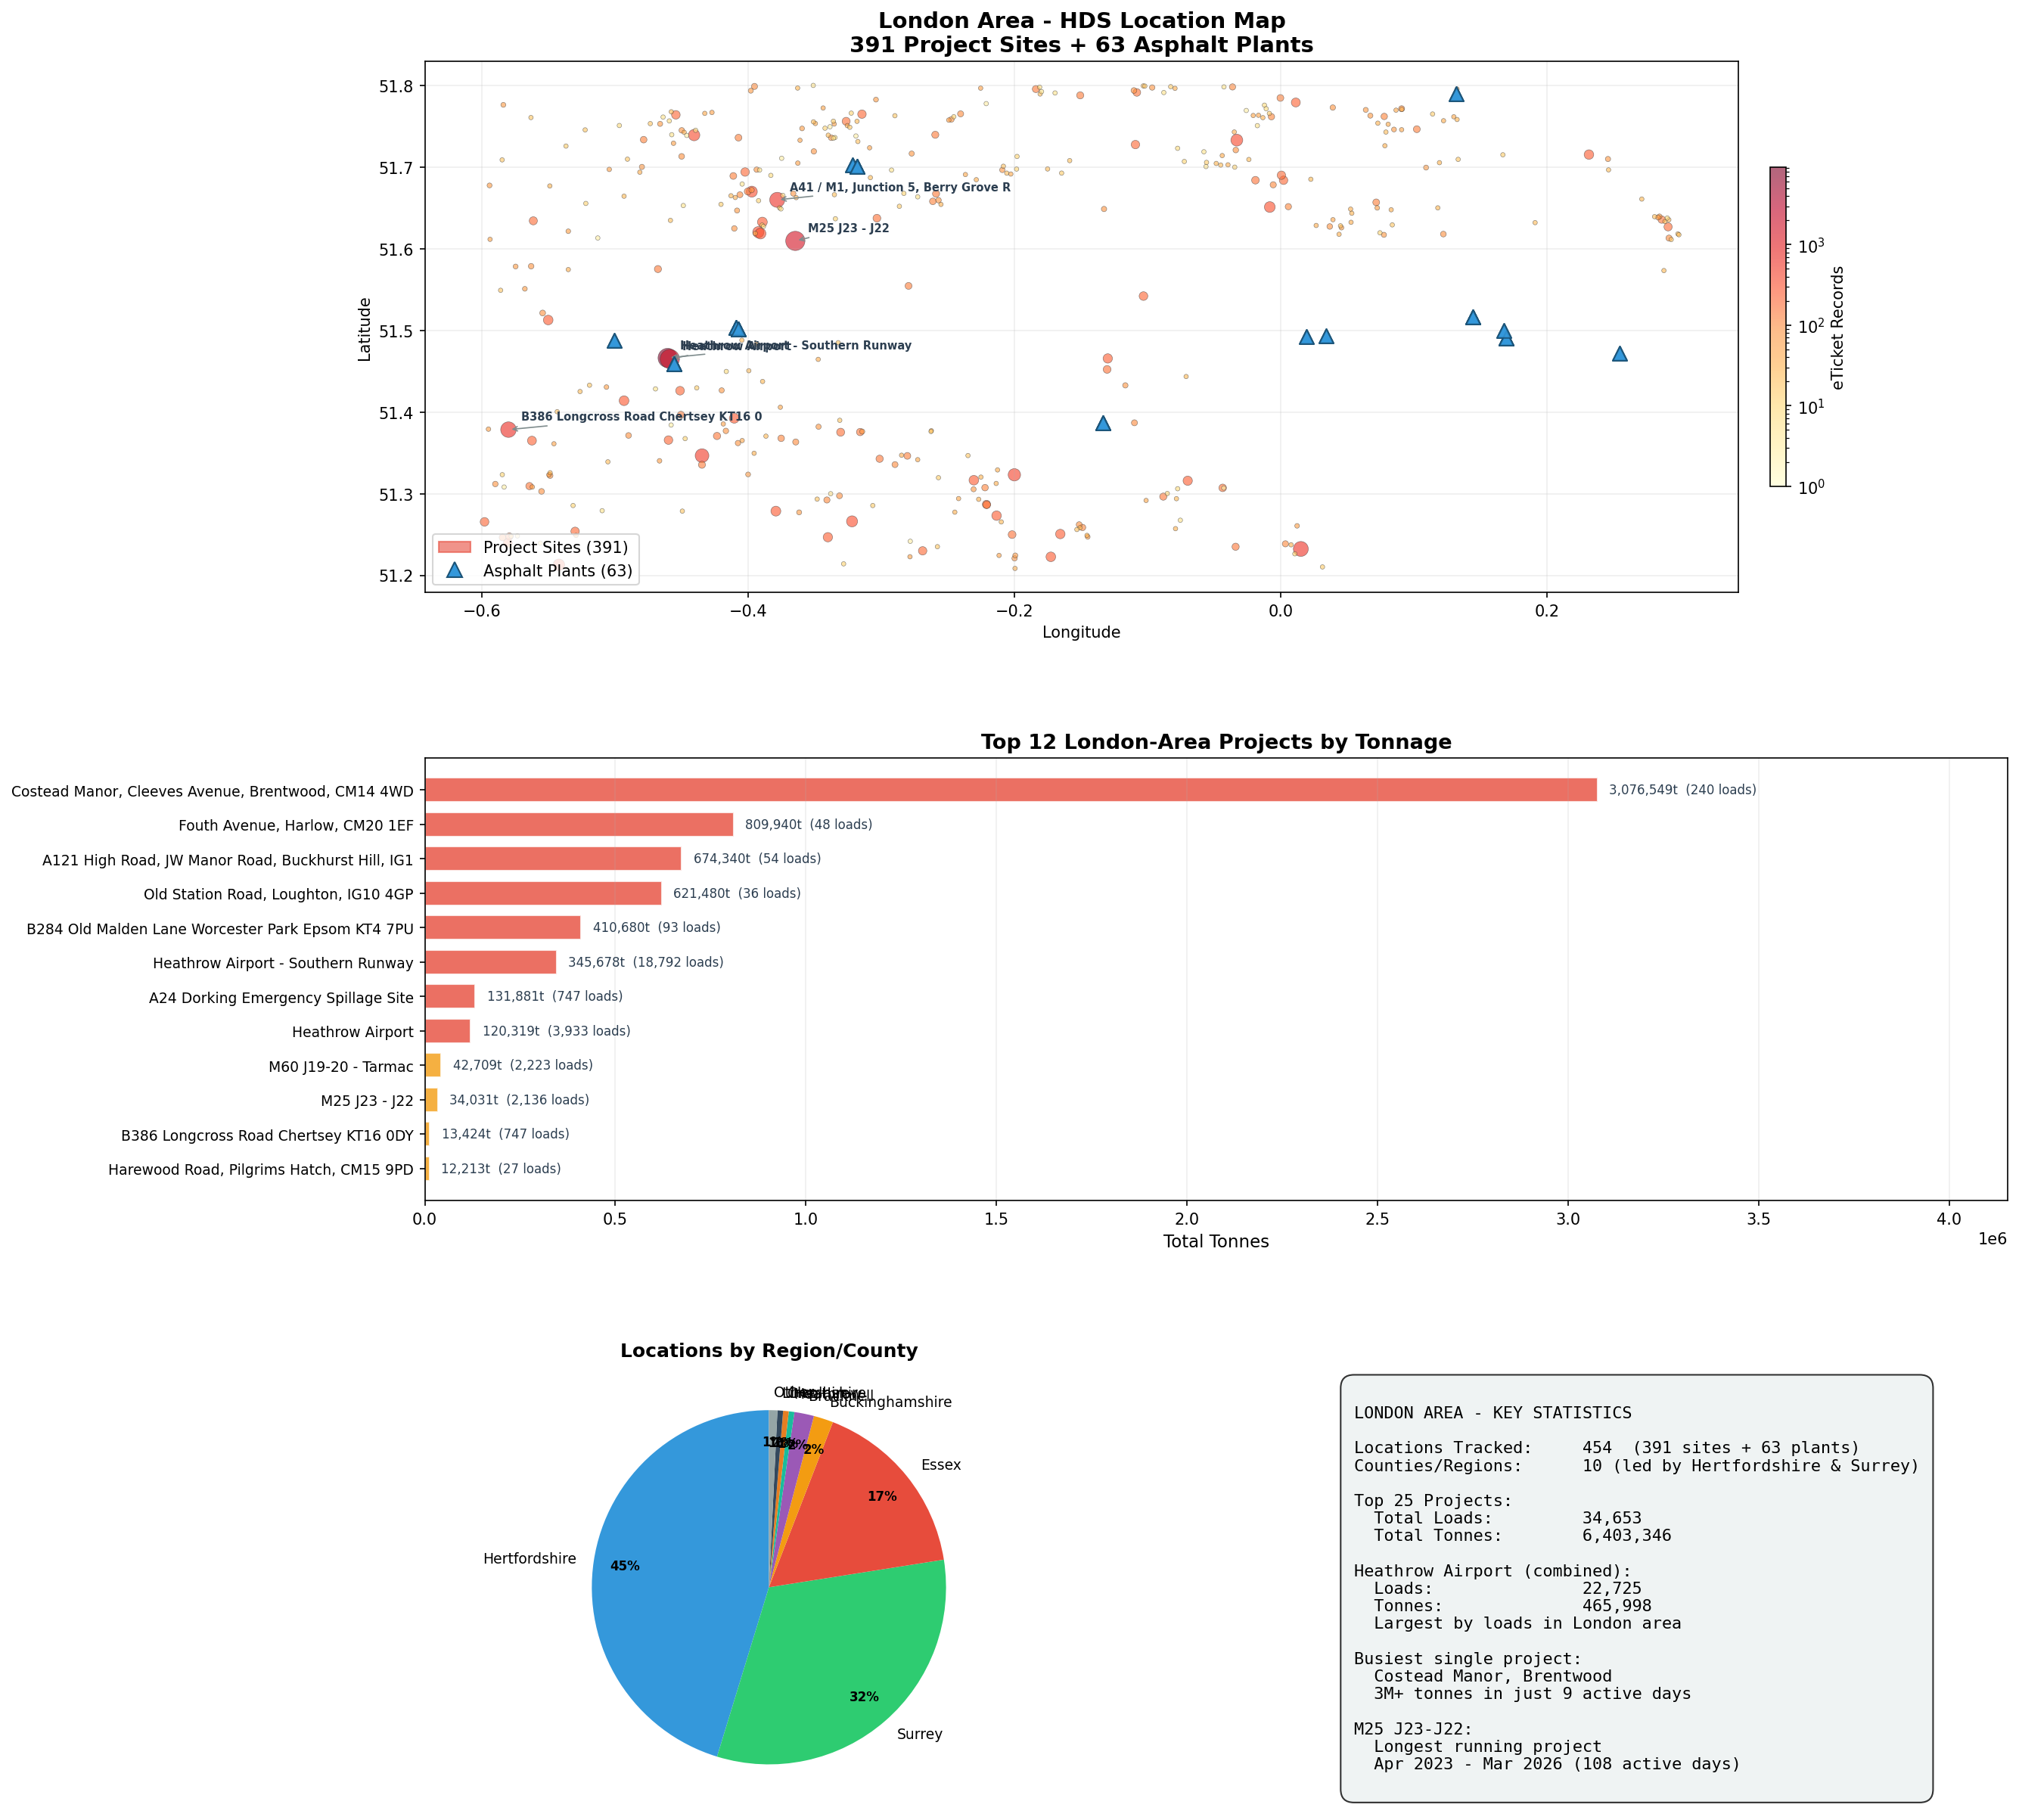
London Area Overview
Overview of HDS activity across the London region.
PNG
479 KB
Modified: 22 May 2026
M8 J13 Compaction Map
Spatial compaction analysis for M8 Junction 13.
PNG
142 KB
Modified: 22 May 2026